Reports turn your event data into polished, easy-to-read summaries you can share with your team or stakeholders, whether as a downloadable PDF or an interactive URL.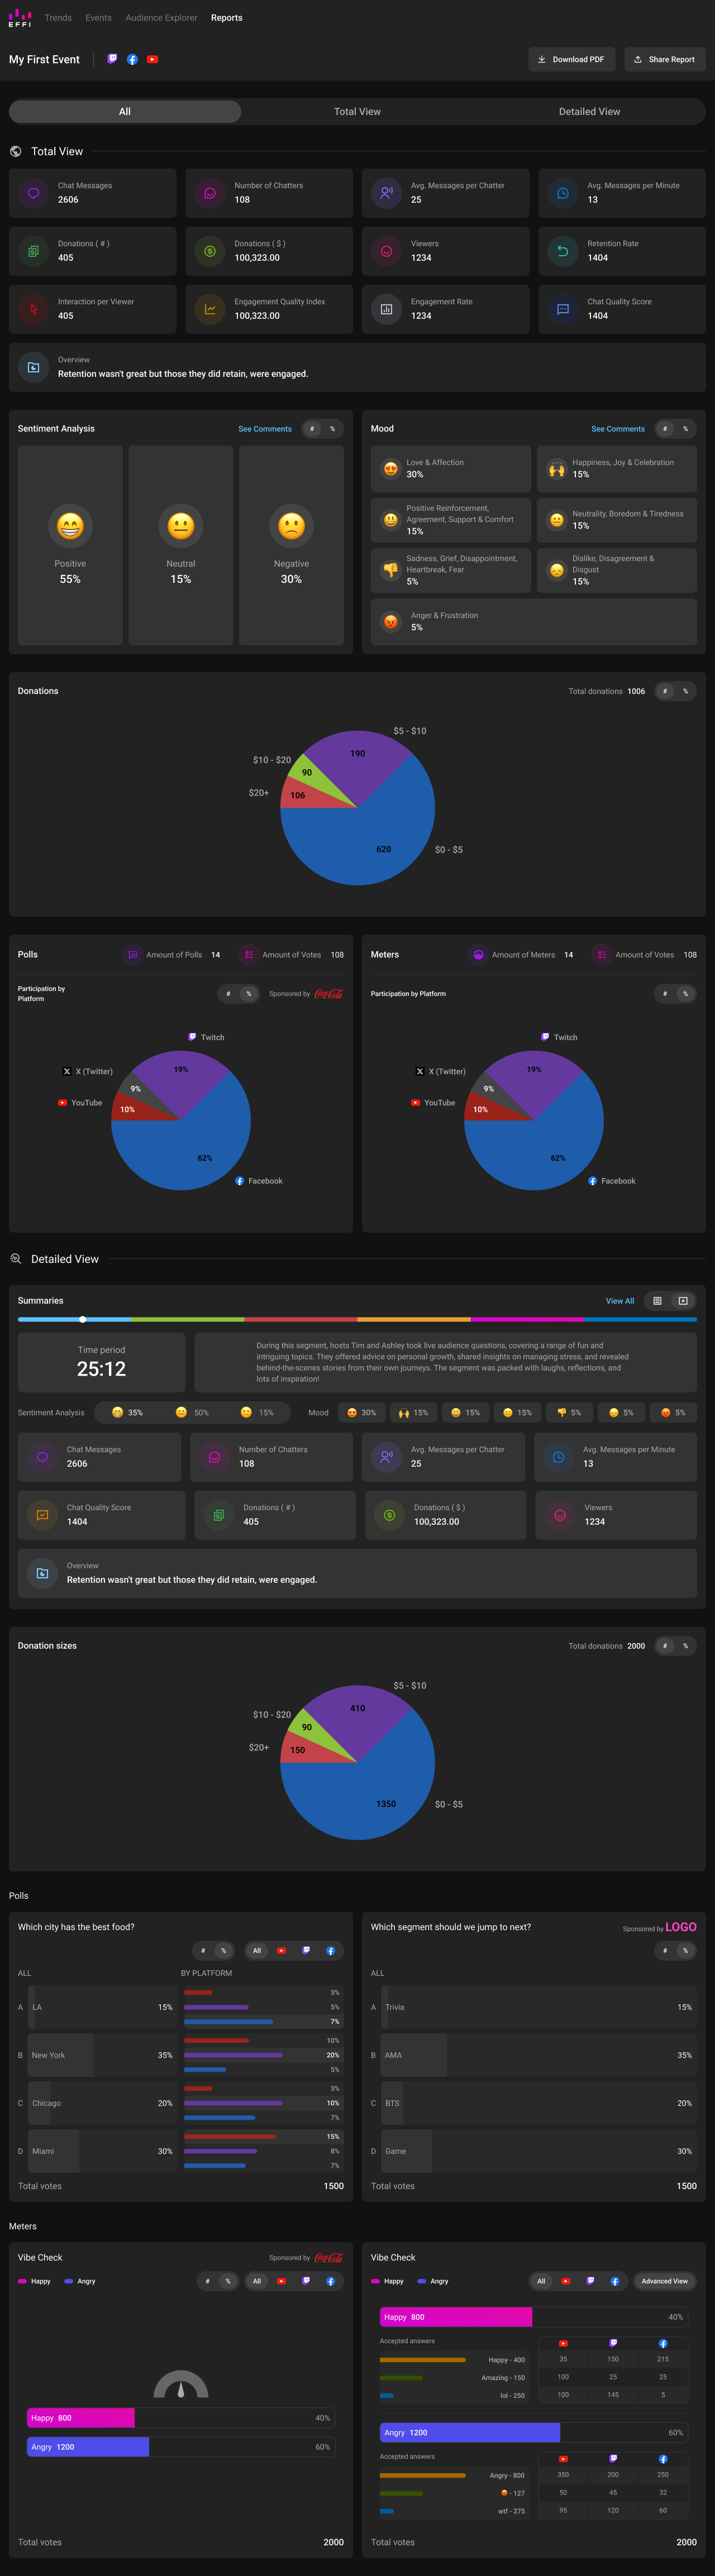
Key Features
- Custom build: choose the exact data points, metrics, and events you want, then save your selections as a template for next time.
- User-friendly design: reports are laid out so anyone, from teammates to external stakeholders, can quickly understand the key takeaways.
- Multiple sharing formats: export as a PDF or generate a shareable URL.
Building a Report
- Navigate to Reports from Analytics in the main menu.
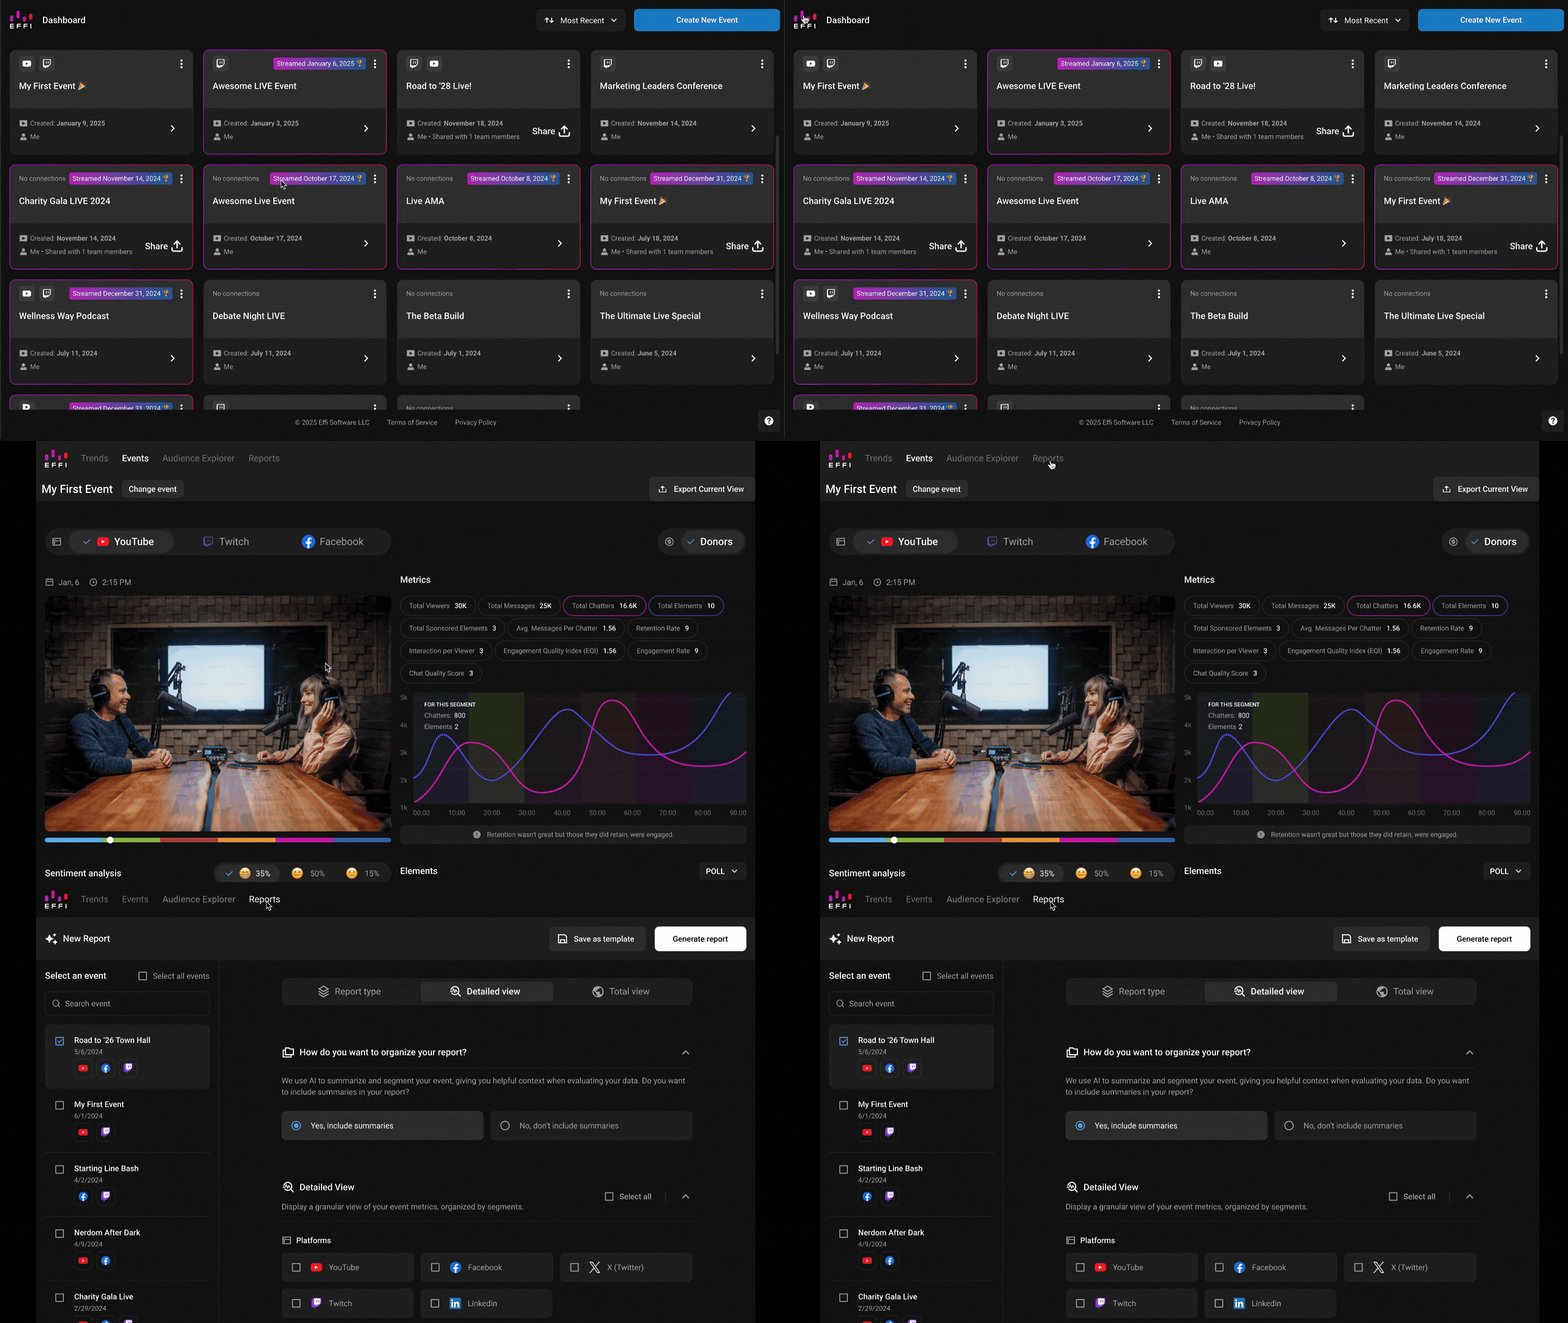
- Choose the event or events you'd like to include, selecting each from the sidebar.
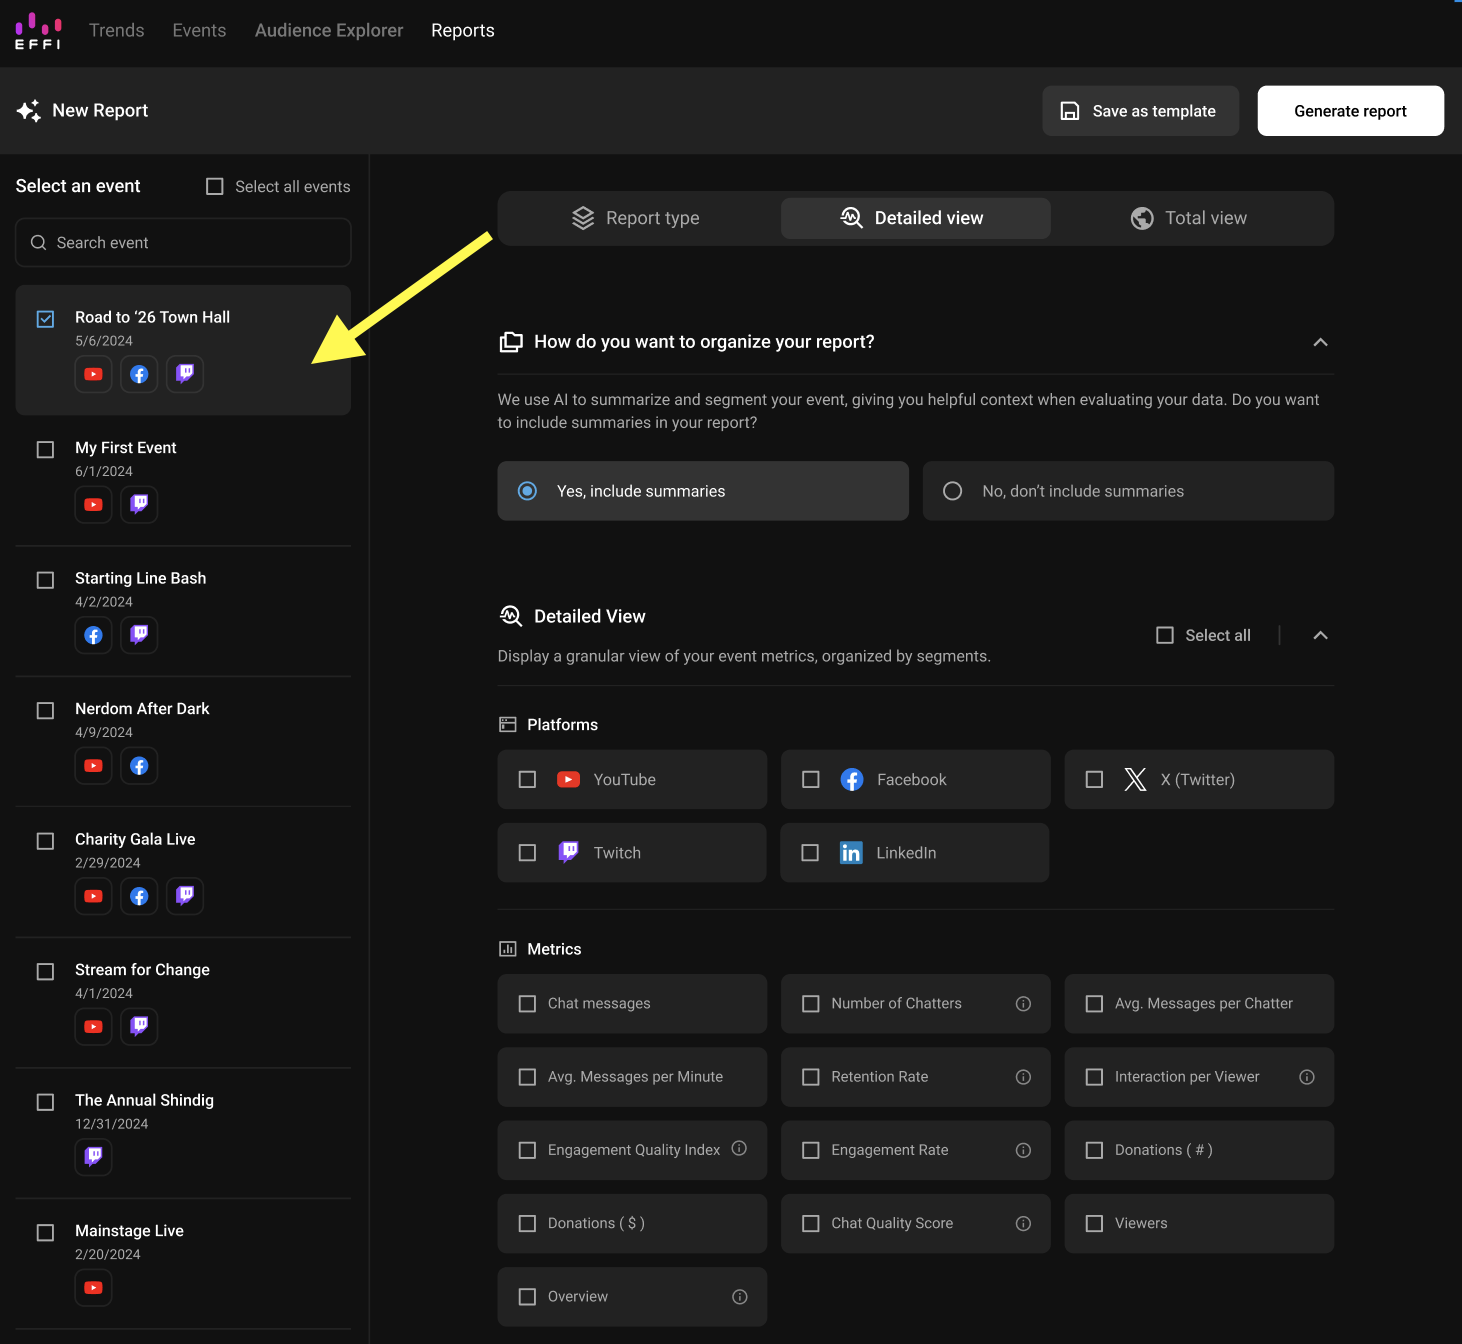
- If you're building a single-event report, decide whether to include AI-generated summaries, which segment your event to add helpful context.
Detailed View vs. Total View
Detailed View breaks your broadcast down segment by segment, so every data point you choose shows up by section rather than as one number. Total View gives you the broadcast as a whole. Detailed View is only available when your report covers a single event.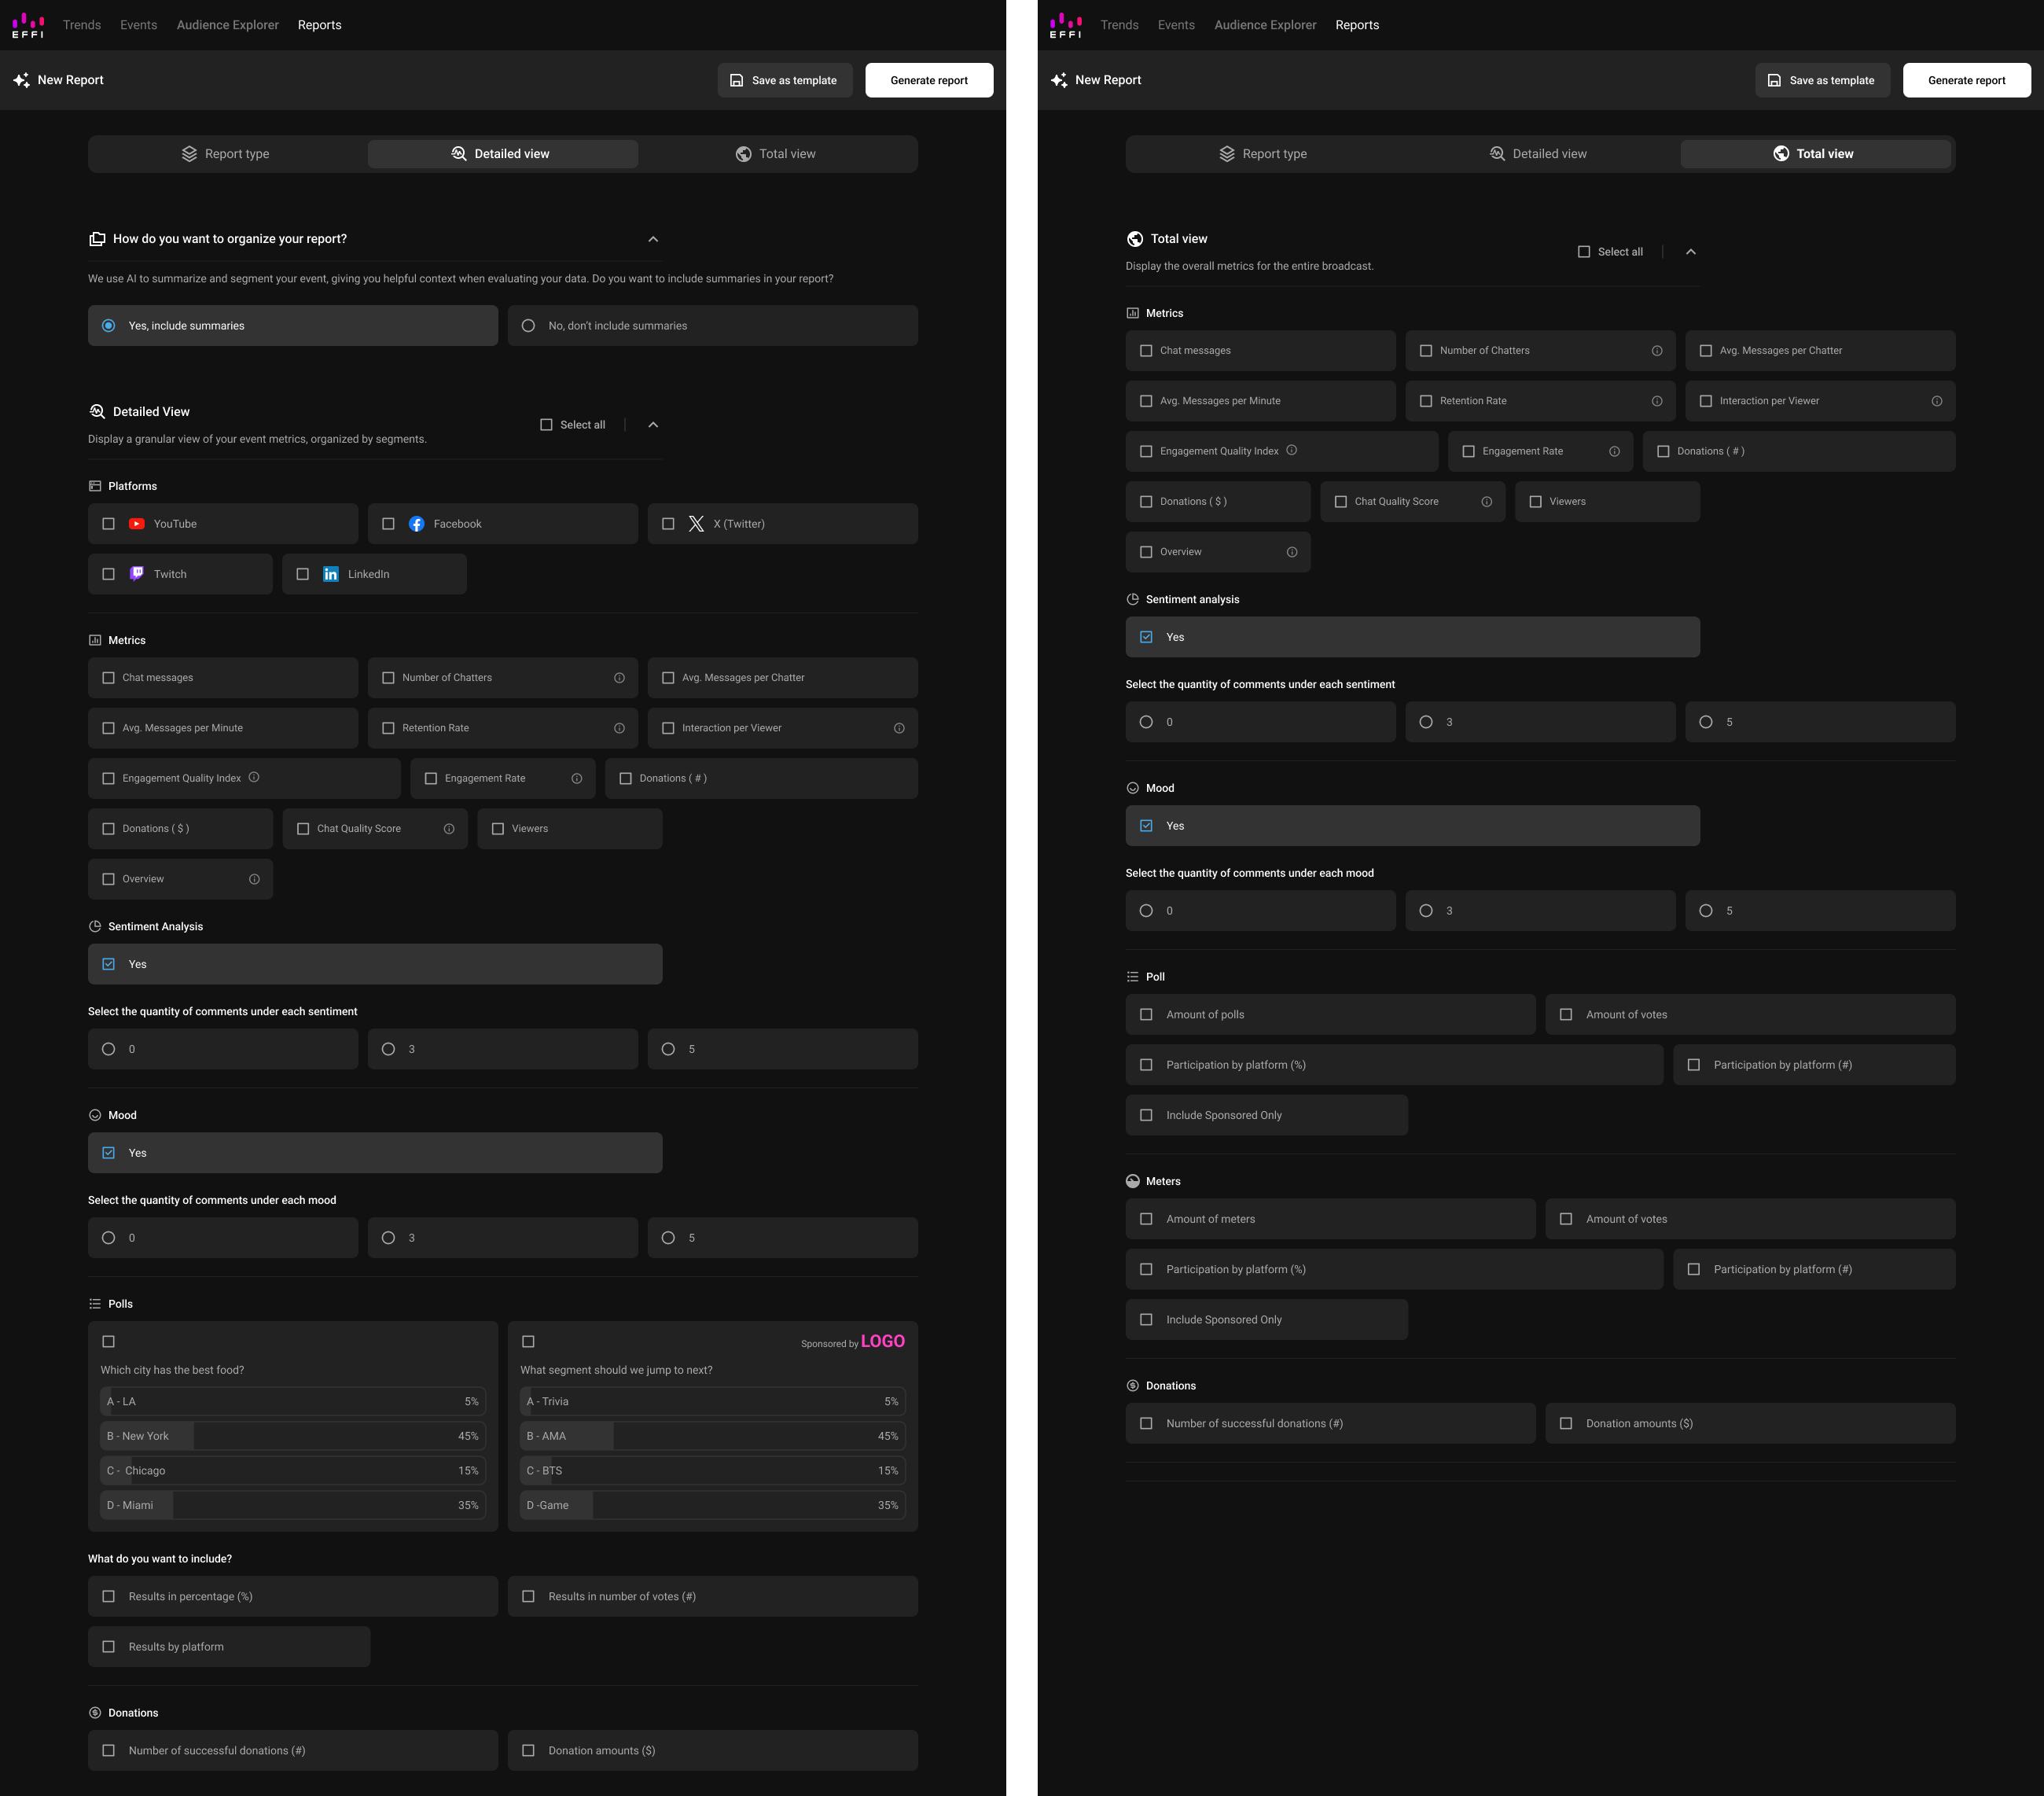
Choosing What to Include
- Platforms: include data for every platform you streamed to, or just a select few.
- Metrics: pick whichever metrics matter most to you, or include them all.
- Sentiment Analysis: a Positive, Neutral, and Negative breakdown of your audience, with the option to include representative comments.
- Mood: a breakdown of audience mood (Love & Affection, Happiness, Positive Reinforcement, Neutrality, Sadness, Dislike, and Anger), also with the option to include representative comments.
- Polls & Meters: results from any polls or meters used during your broadcast, like platform-by-platform voting breakdowns.
- Donations: for Streamocracy users, donation totals and sizes.
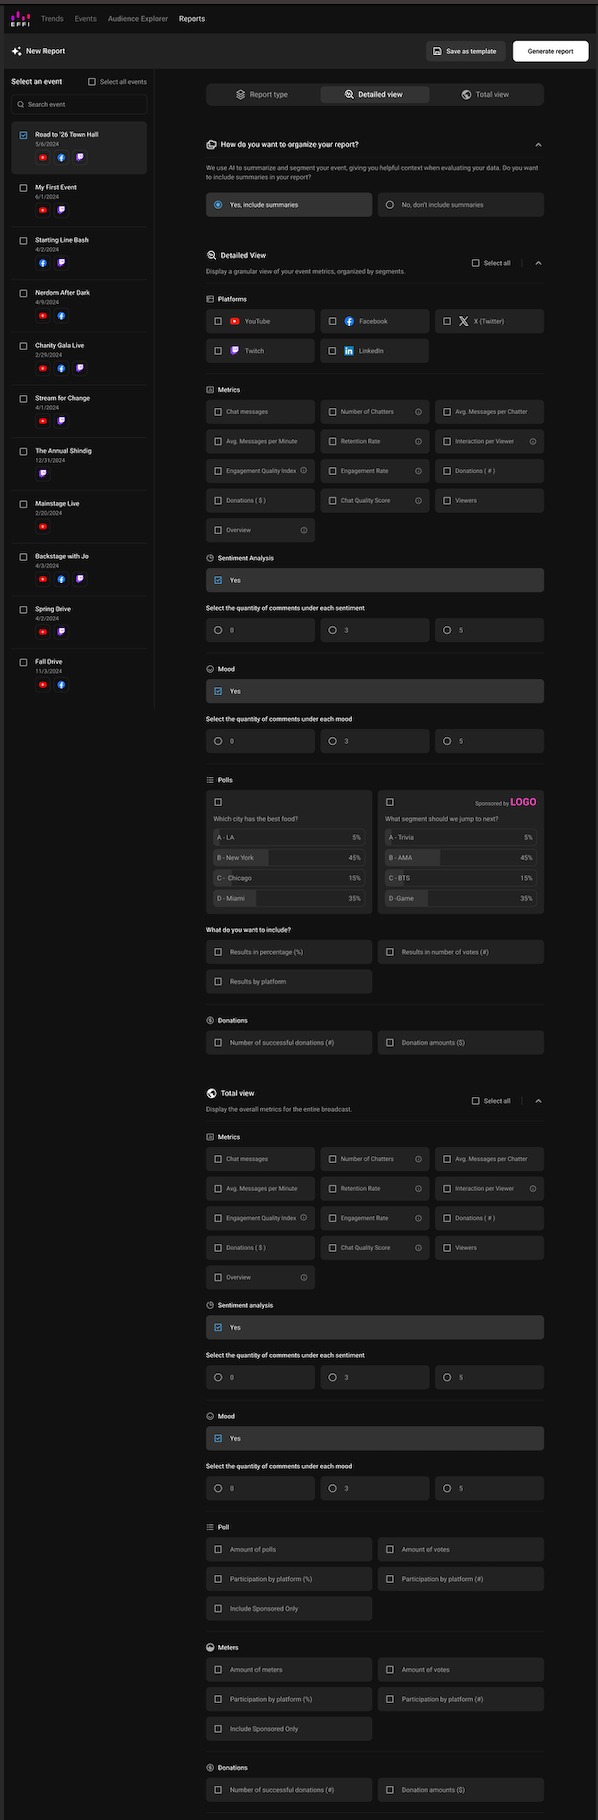
Once you've made your selections, click Generate Report.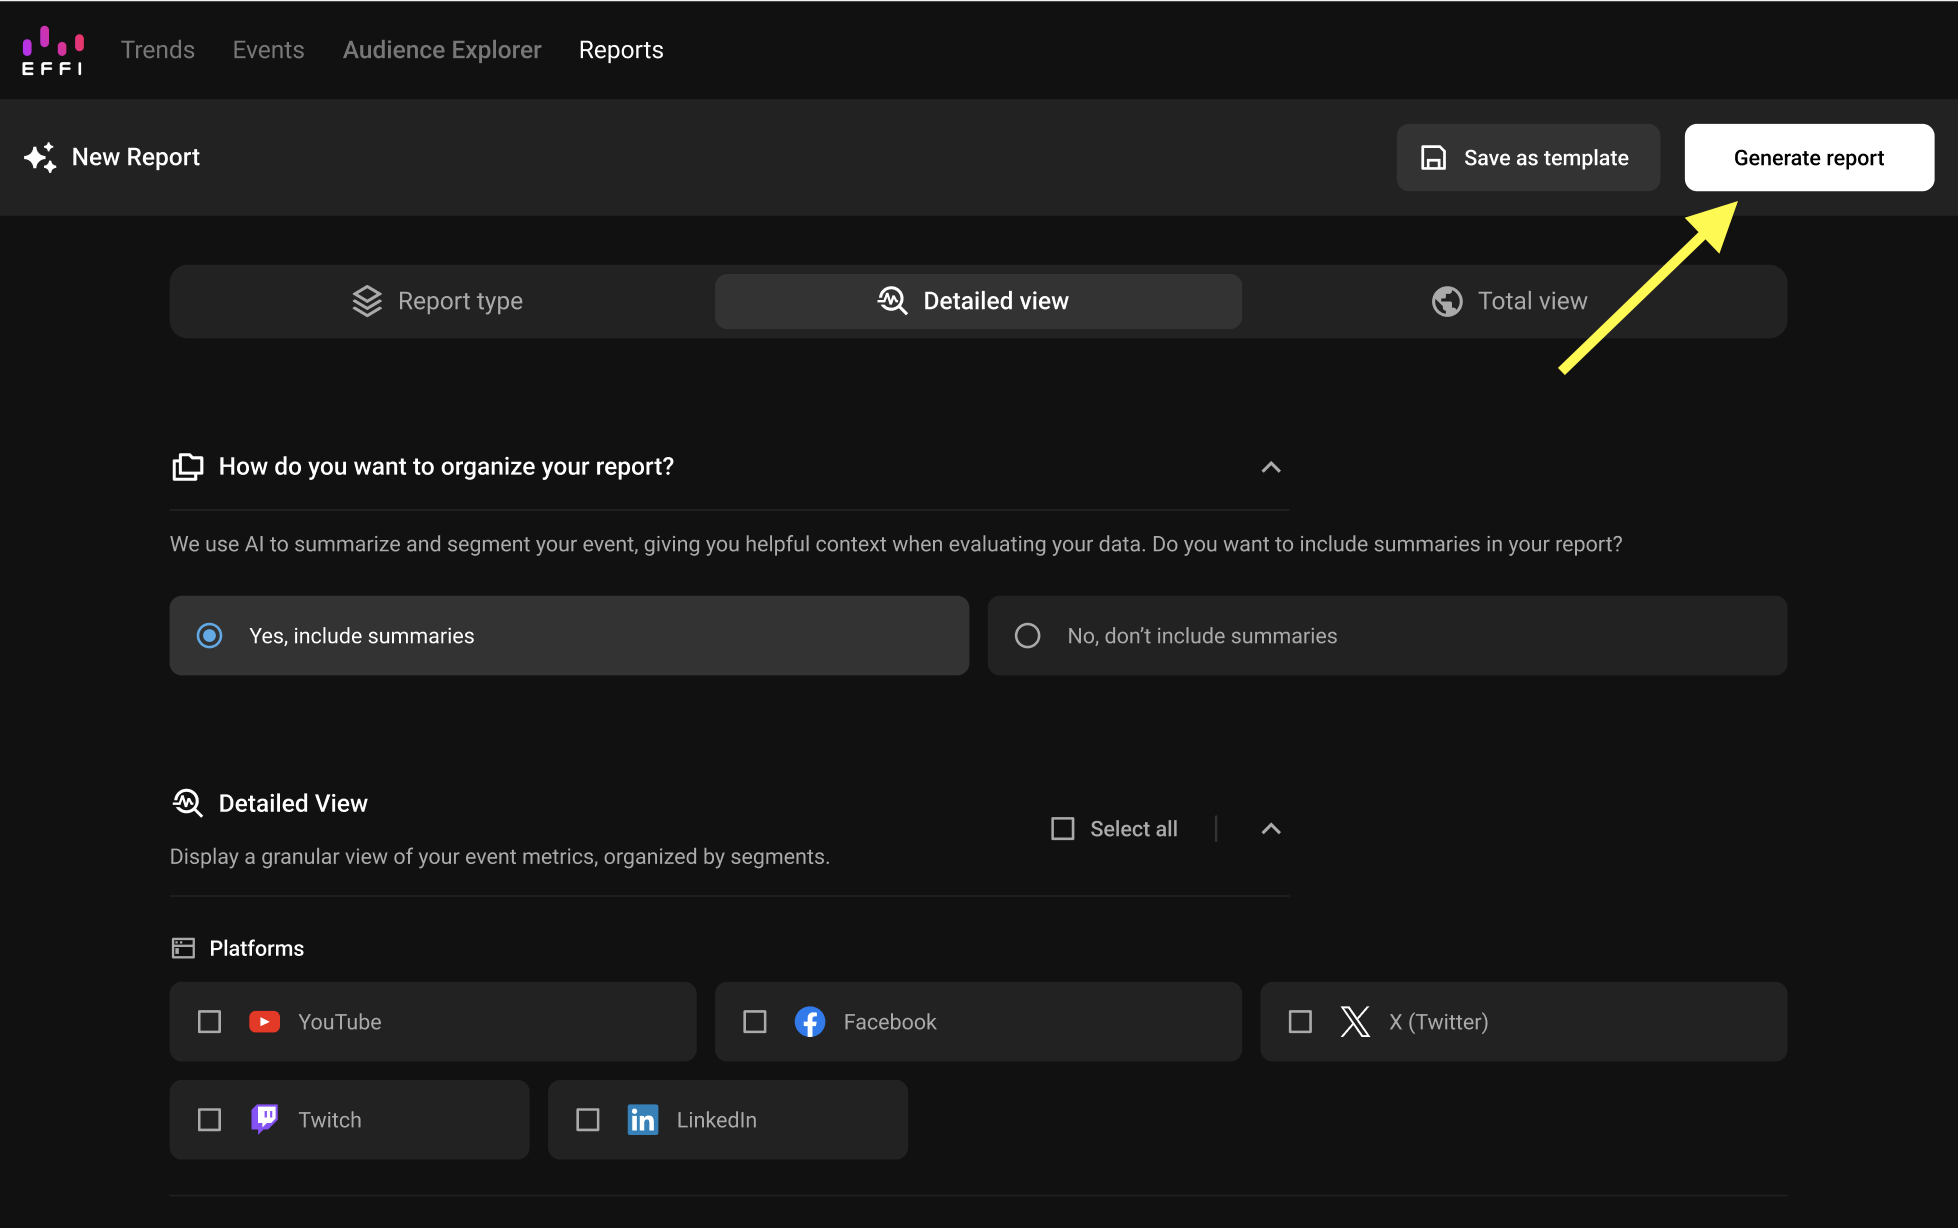
Saving a Report as a Template
If you've built a report layout you'll want to reuse, save it as a template instead of rebuilding it from scratch next time. Click Save as Template before generating, then give it a name and description.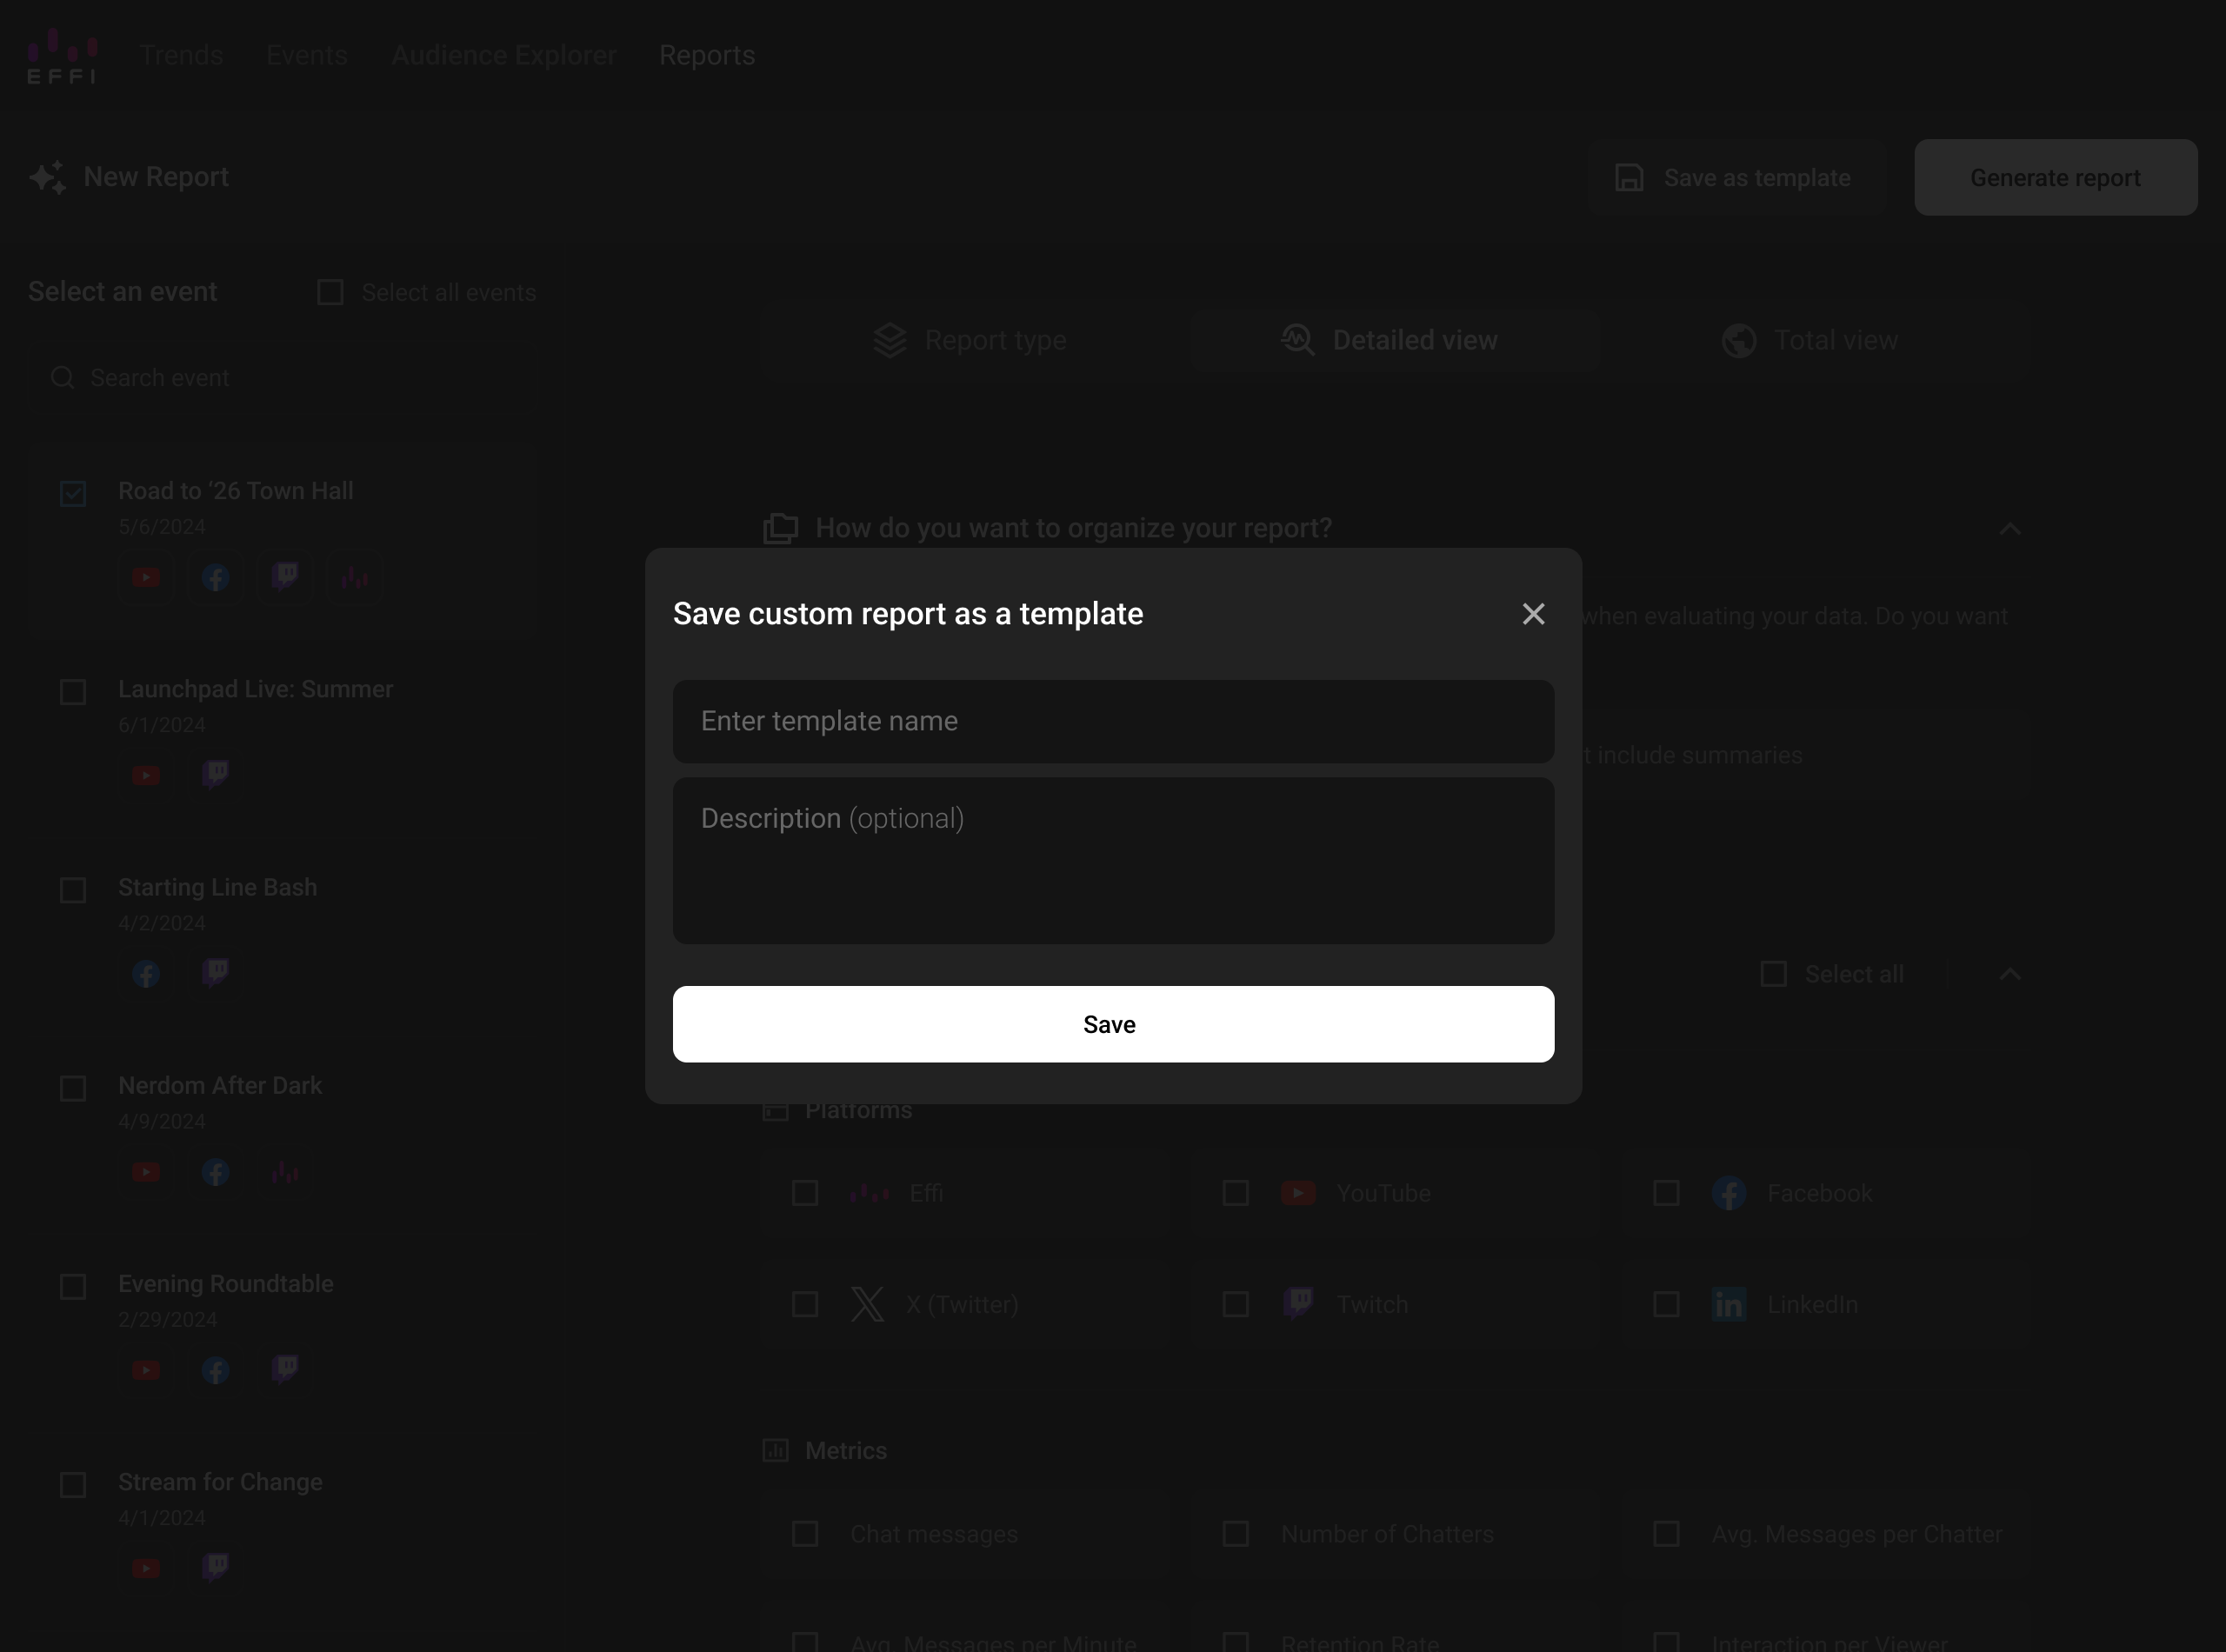
Sharing a Report
From an Open Report
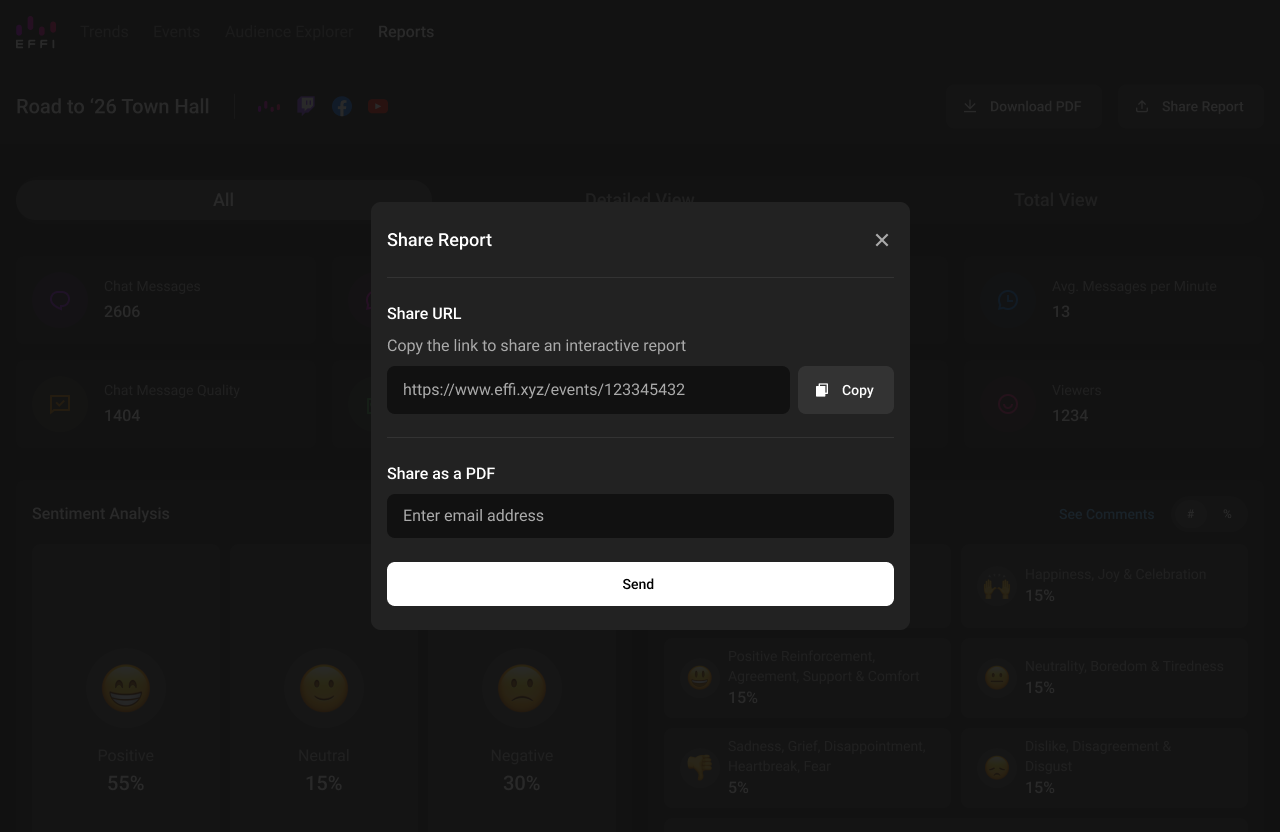
Click Share Report at the top of your generated report to get a shareable URL, or send it as a PDF straight to an email address.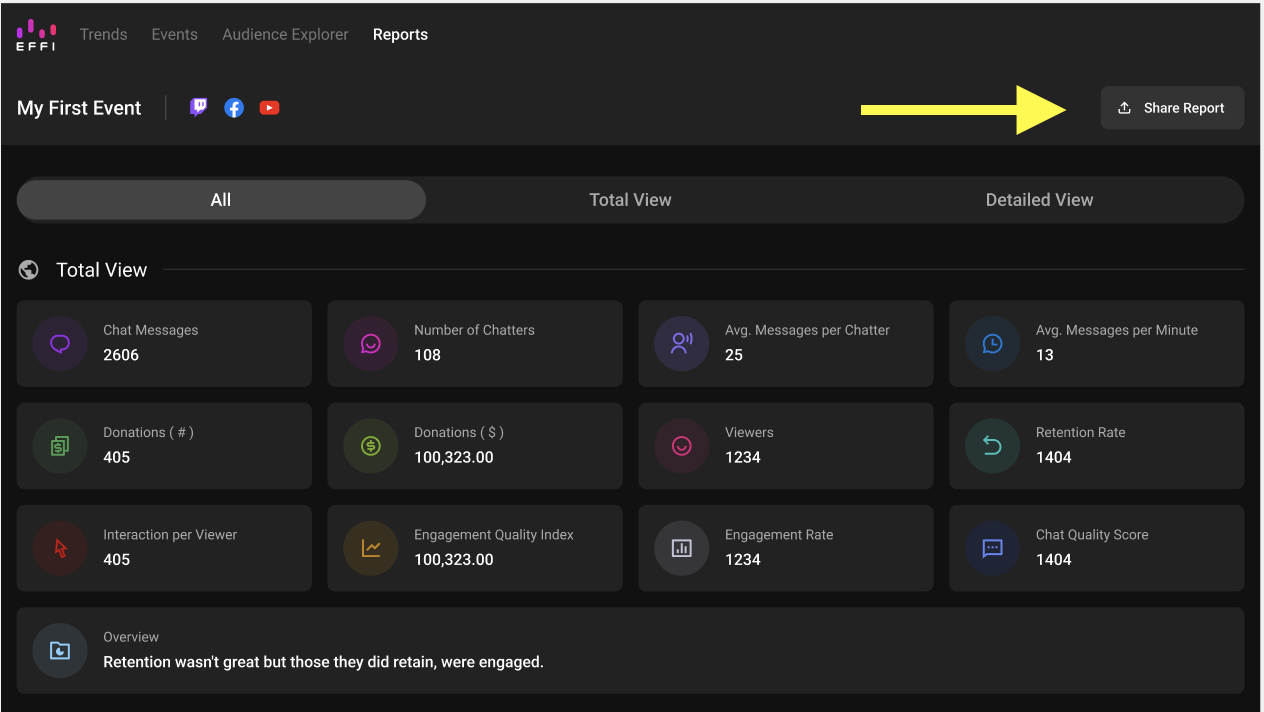
From the Reports Dashboard
Need to share a report you generated earlier? You don't have to open it first. Just click the share icon next to it right from the Reports dashboard.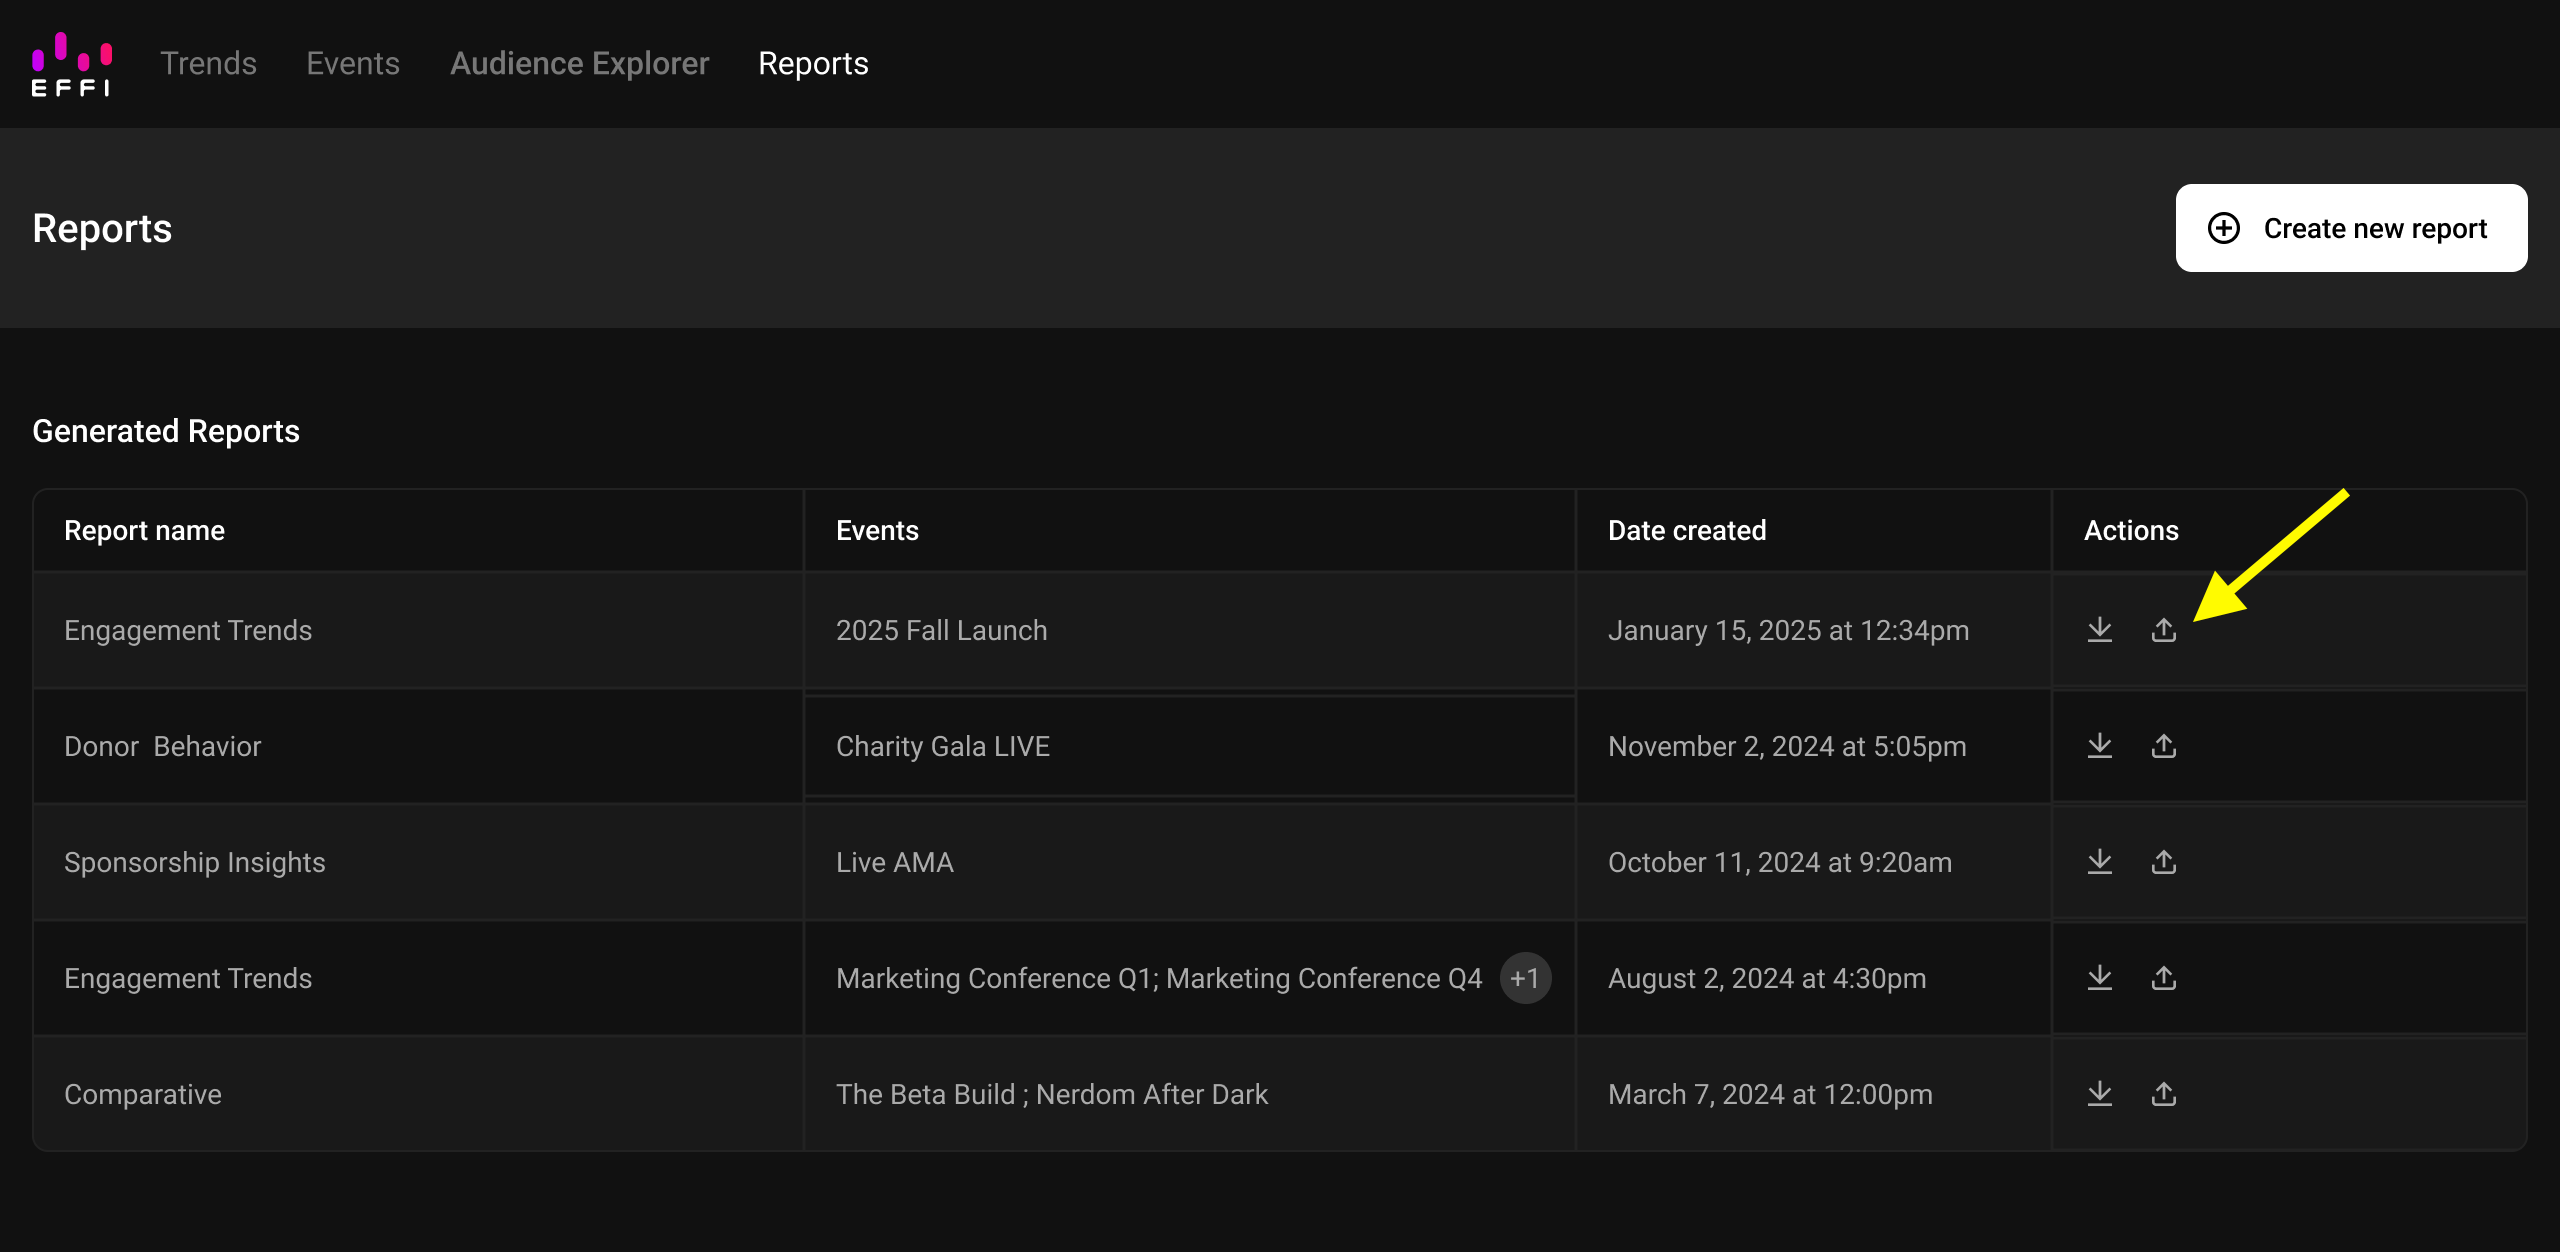
Reports for Multiple Events
You can include as many events as you'd like in a single report to compare performance across broadcasts. Multi-event reports work a little differently from single-event ones: since Detailed View isn't available, you'll only see Total View, presented more like the Trends page, with a metrics chart and a compare table rather than the segment-by-segment layout of a single-event report.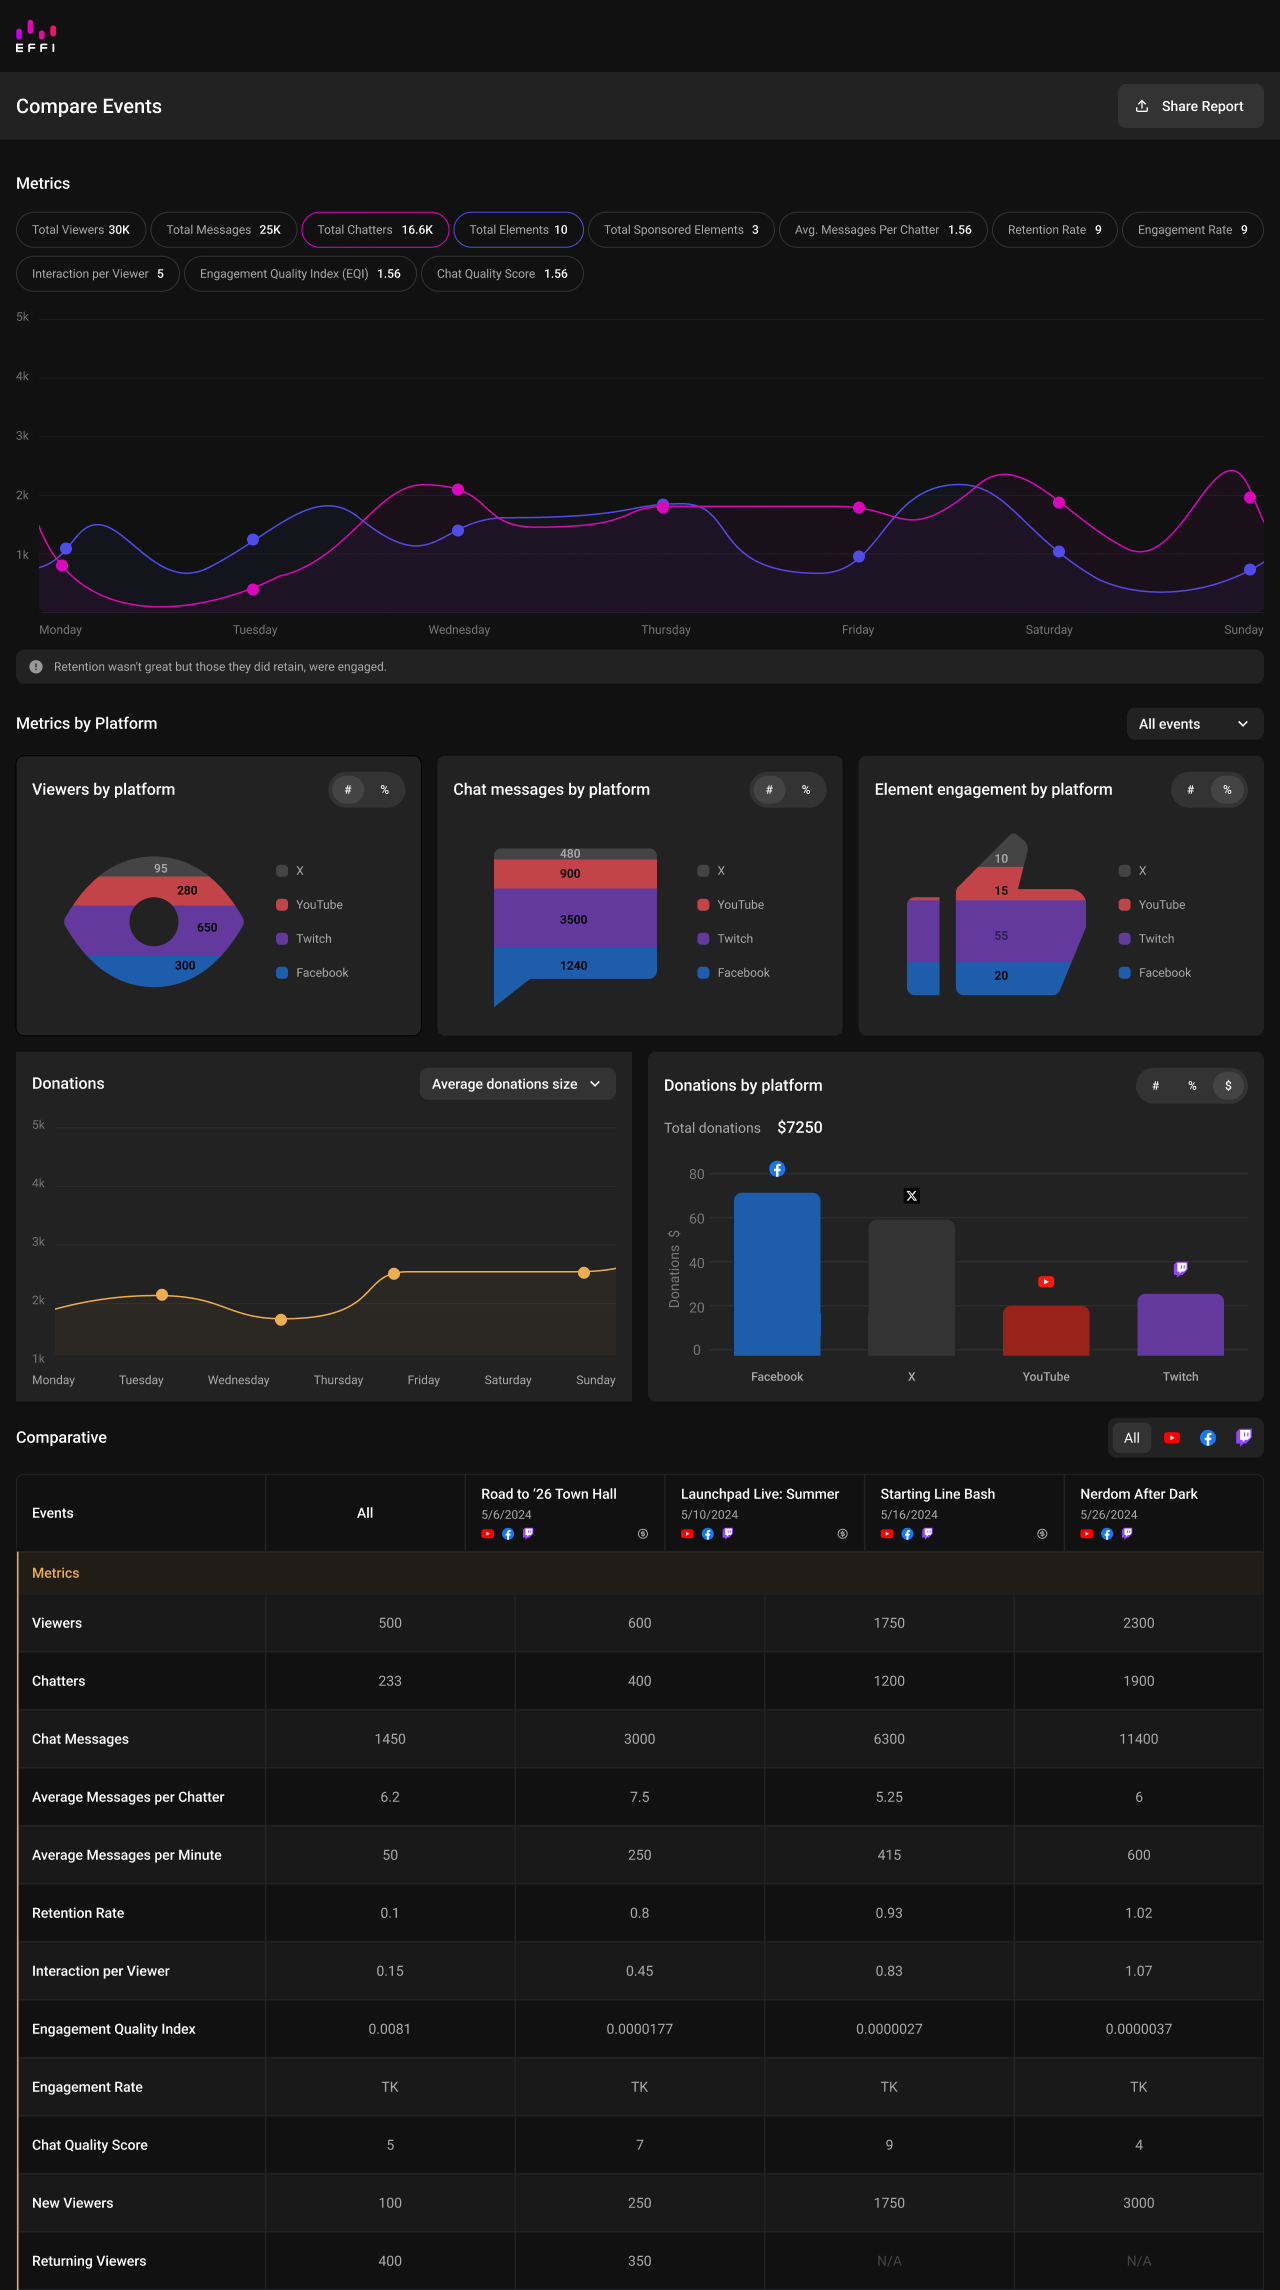
Creating Multiple Reports for the Same Event
There's no limit to how many reports you can build for the same event. Create separate reports tailored to different audiences or goals, like one highlighting engagement for your internal team and another focused on donations for a sponsor.
Was this article helpful?
That’s Great!
Thank you for your feedback
Sorry! We couldn't be helpful
Thank you for your feedback
Feedback sent
We appreciate your effort and will try to fix the article